Two different areas of remote design education at OCAD University this fall will feature COVID-19 as a vehicle to promote learning that directly relates to the design needs of our times.
In the Industrial Design undergraduate program, Associate Professor Angelika Seeschaaf-Veres is approaching the pandemic as a problem-based learning opportunity in the third-year Design for Health course. It focuses on using human-centred design methods and human factors to design corona virus-related health and wellness products, services, systems and experiences.
“This course explores responsible design that includes useful, usable and desirable products and services for those who are largely ignored by the market and social structures.” says Seeschaaf-Veres.
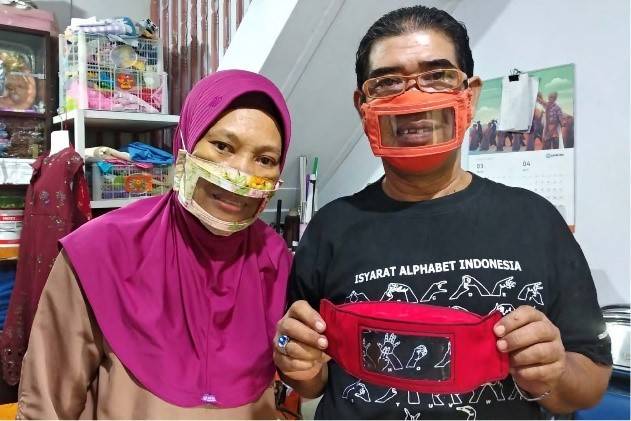
Through a mix of lectures, discussions, assignments, and peer meet-ups, the students will learn about health-related design theories and methods they can apply to develop their own COVID-19 design intervention. The process will also probe how the intersectional aspects of race, class and gender can lead to bias in health care and how design can be used to address this challenge. Seeschaaf-Veres will share examples of coronavirus health-care design innovations that cater to differently abled individuals and developing economies.
“Diverse design applications can drive innovation, decrease systemic barriers and increase access to health and wellness for all,” says Seeschaaf-Veres. “Innovation during challenging times, for example, the cholera pandemic in London, England in the 1850s, saw the creation of the medical field of epidemiology, data visualization and the invention of public sewage systems and everyday objects such as sinks and water toilets that we take for granted now. “
Meanwhile, faculty member Karin von Ompteda will engage students in examining COVID-19 data visualization trends in Graphic Design 3, the third-year core course she teaches in the Graphic Design undergraduate program.
“Our understanding of the pandemic is often associated with data, which determines many aspects of our lives as lockdowns have lifted,” says von Ompteda. “But for many people, the data feel abstract, making it difficult to grasp the gravity of the situation.”
One of the major projects in the course will focus on communicating COVID-19 data through the design of objects, installations, and sensory experiences. Students will approach the data critically, examining for example what information may be missing, such as disparities of diagnosis rates among racialized communities. As an example of an out-of-the-box design approach to give meaning to complex data, she cites an installation by Diego De la Torre, a 2018 graphic design student who used hanging IV drips to reflect accelerated ice melt in Greenland and Antarctica due to global warming – each drip represented an amount of water equaling one Olympic-sized pool.
“Through metaphor, analogy, objects and sensory experiences, we can enable people to have a more meaningful connection to data,” says von Ompteda. “Developing a strong literacy around data and statistics will help the students not just in their graphic design careers, but in their lives.”
